If you manage a website, chances are that you use an analytics service, such as Google Analytics, Mixpanel or Matomo. An analytics service helps you determine the number of visitors you have, where they come from (in terms of geography and in terms of the referring site), the durations of their visits and how they use your site.
For apps you create with Calcapp, there hasn’t been anything comparable in the past (unless, of course, you embed apps in your website). That means that you’ve had no way to measure your app’s popularity or determine, say, the number of sales inquiries sent through the app.
Our April update introduces our statistics feature, which will help answer some of the questions you may have about how your app is doing. (We don’t call it “analytics,” because our feature set is currently limited compared to what most analytics services offer.)
Bring up the statistics window by selecting View Statistics… from the user menu (the button with your email address and an arrow in Calcapp Creator):
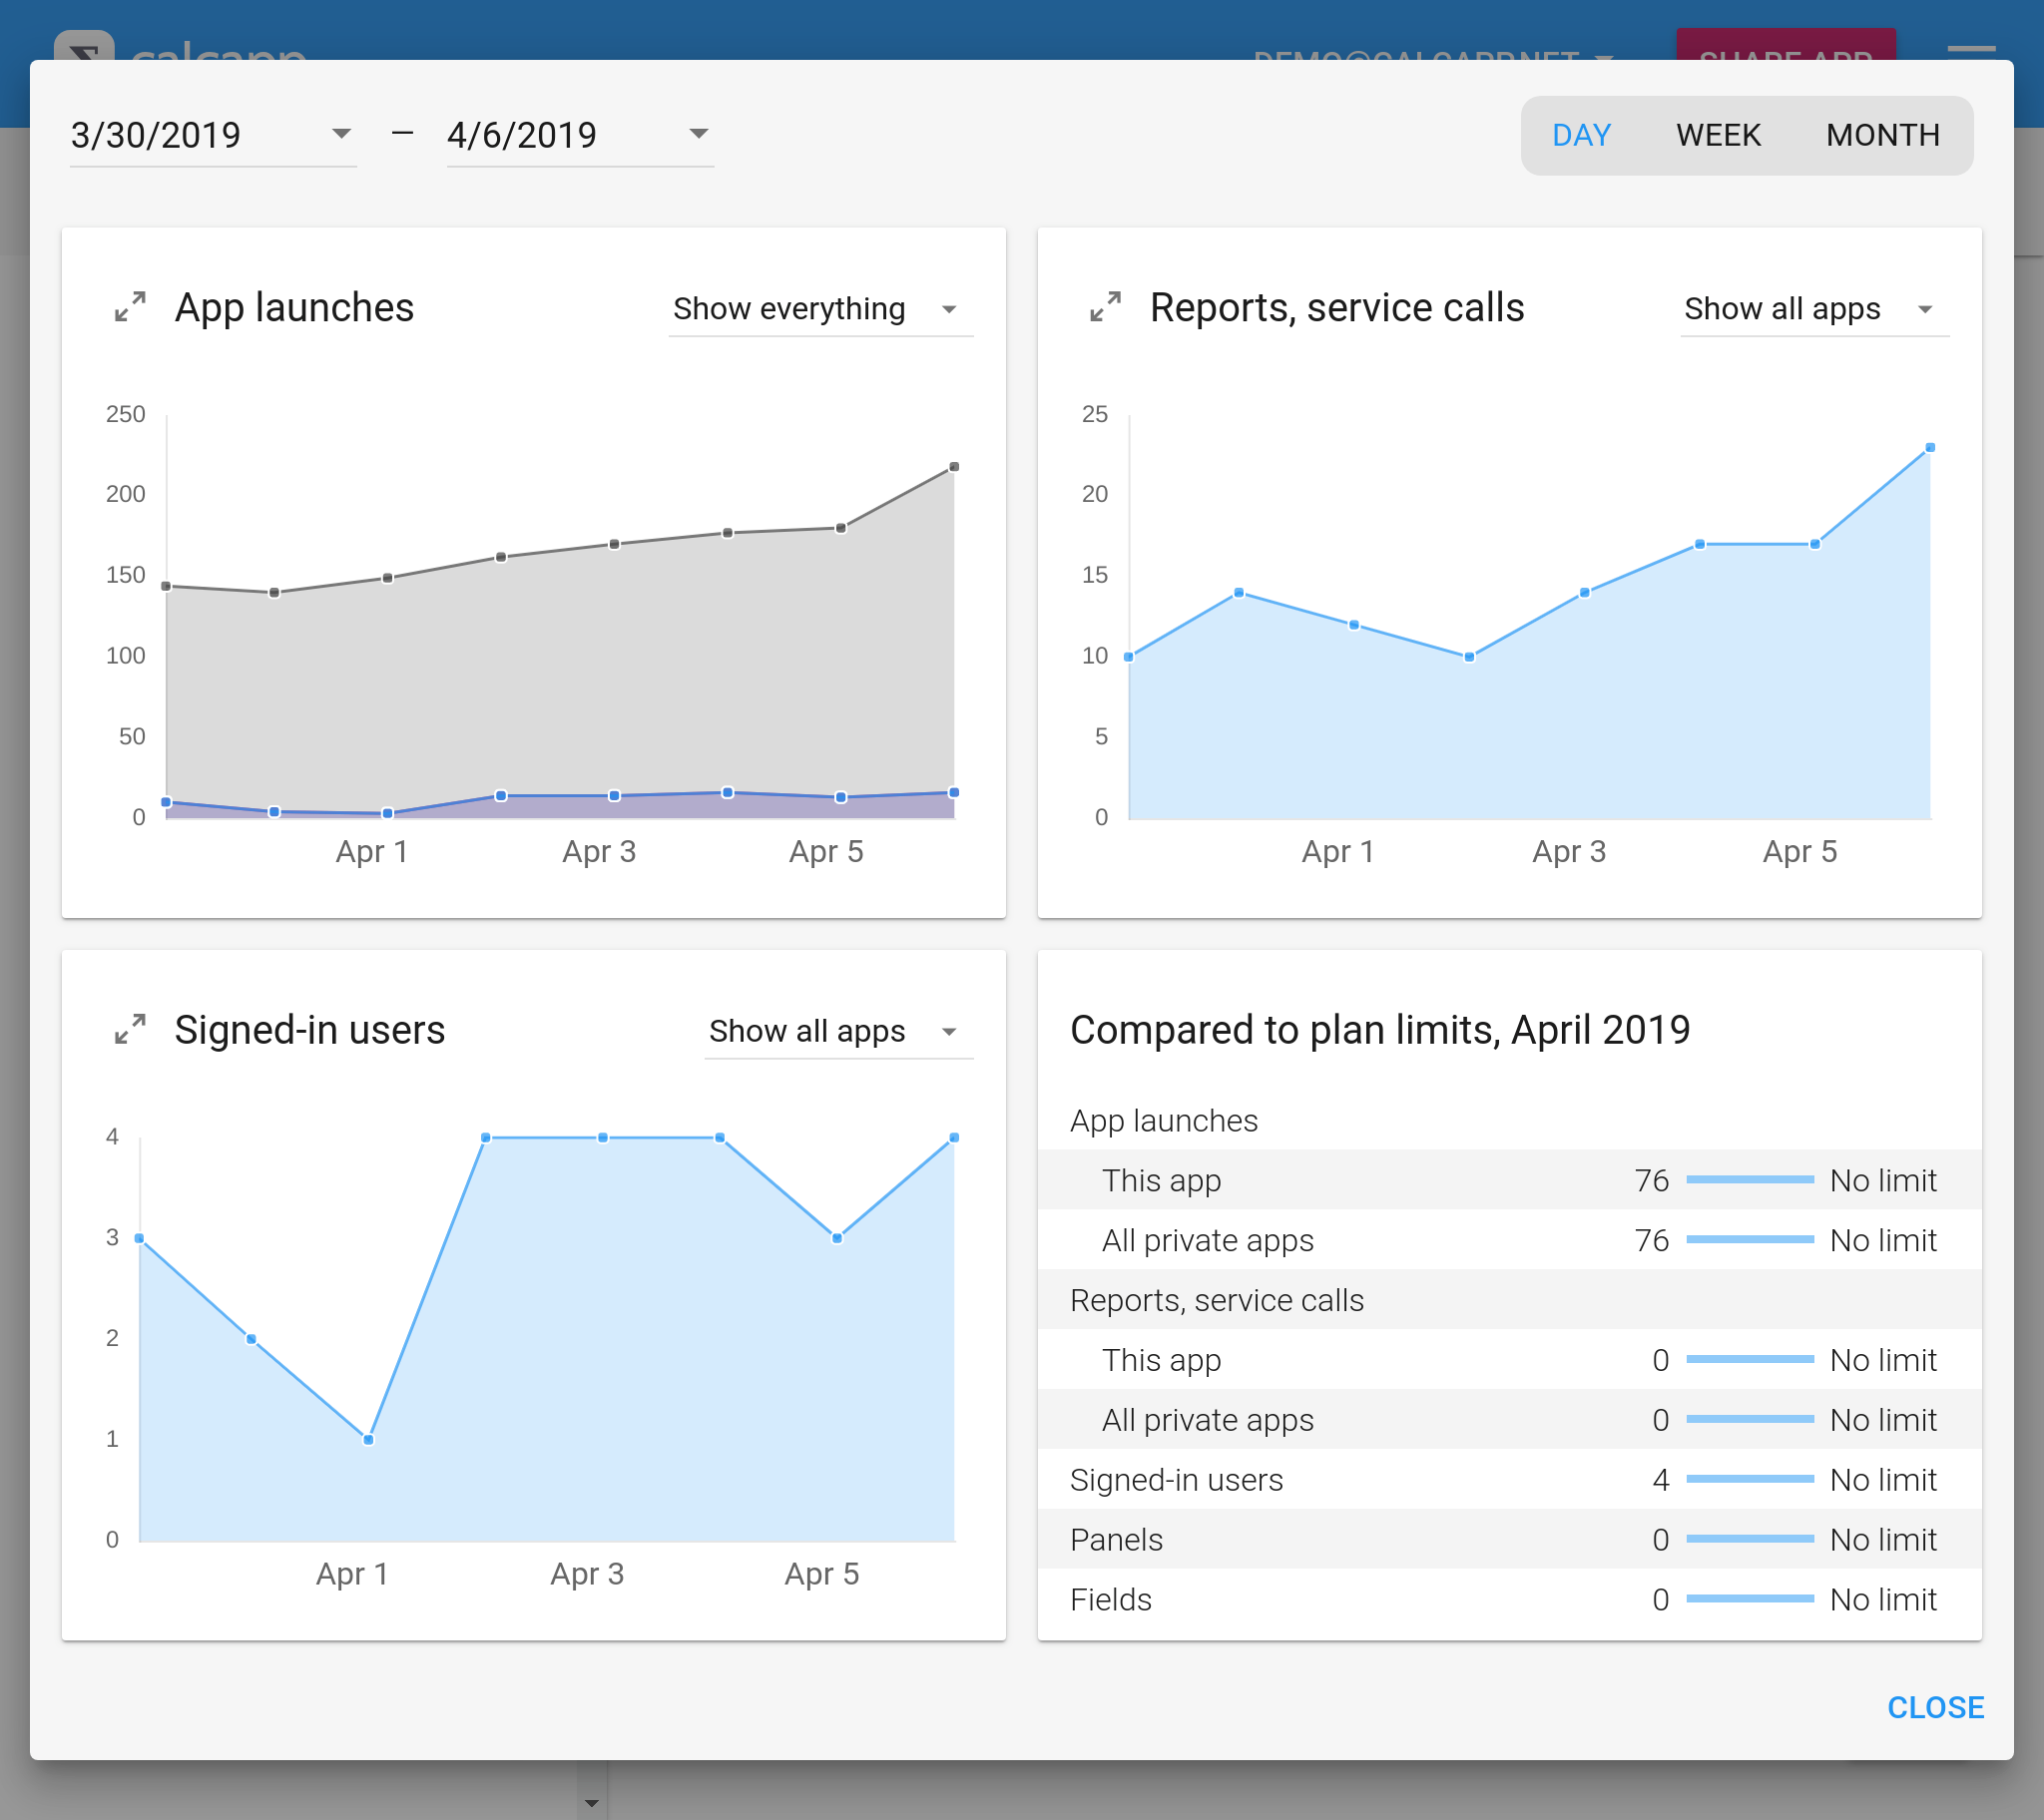
There are four quadrants: App launches, Reports and service calls, Signed-in users and Compared to plan limits.
The first quadrant reports the number of times your app has been launched. The second quadrant tracks the number of times that reports have been emailed, opened or a service call has been made. (A service call occurs when your app contacts a third-party service, such as Zapier, to do things like insert a row in a Google Sheets spreadsheet.) The third quadrant tracks the number of times users have signed into your private app.
The fourth and final quadrant compares your current usage to the monthly limits imposed by your app’s plan. (In the image above, the user’s free trial is active, meaning that there are no limits.) This is a great way to keep track of usage and upgrade your plan before you hit the plan limits, or to downgrade if you’re paying for an unnecessarily expensive plan.
The statistics window is a feature of the Business and White Label plans. If your app is on the Free plan or the Starter plan, the entire window is devoted to plan limits and there are no graphs.
Use the date pickers in the upper-left corner to change the date range and the controls in the upper-right corner to change whether data is reported on a daily, weekly or monthly basis. If your date range encompasses a long period of time, aggregating data on a weekly or monthly basis is especially advantageous.
For a zoomed-in view, click the zoom-in button next to a quadrant of interest:
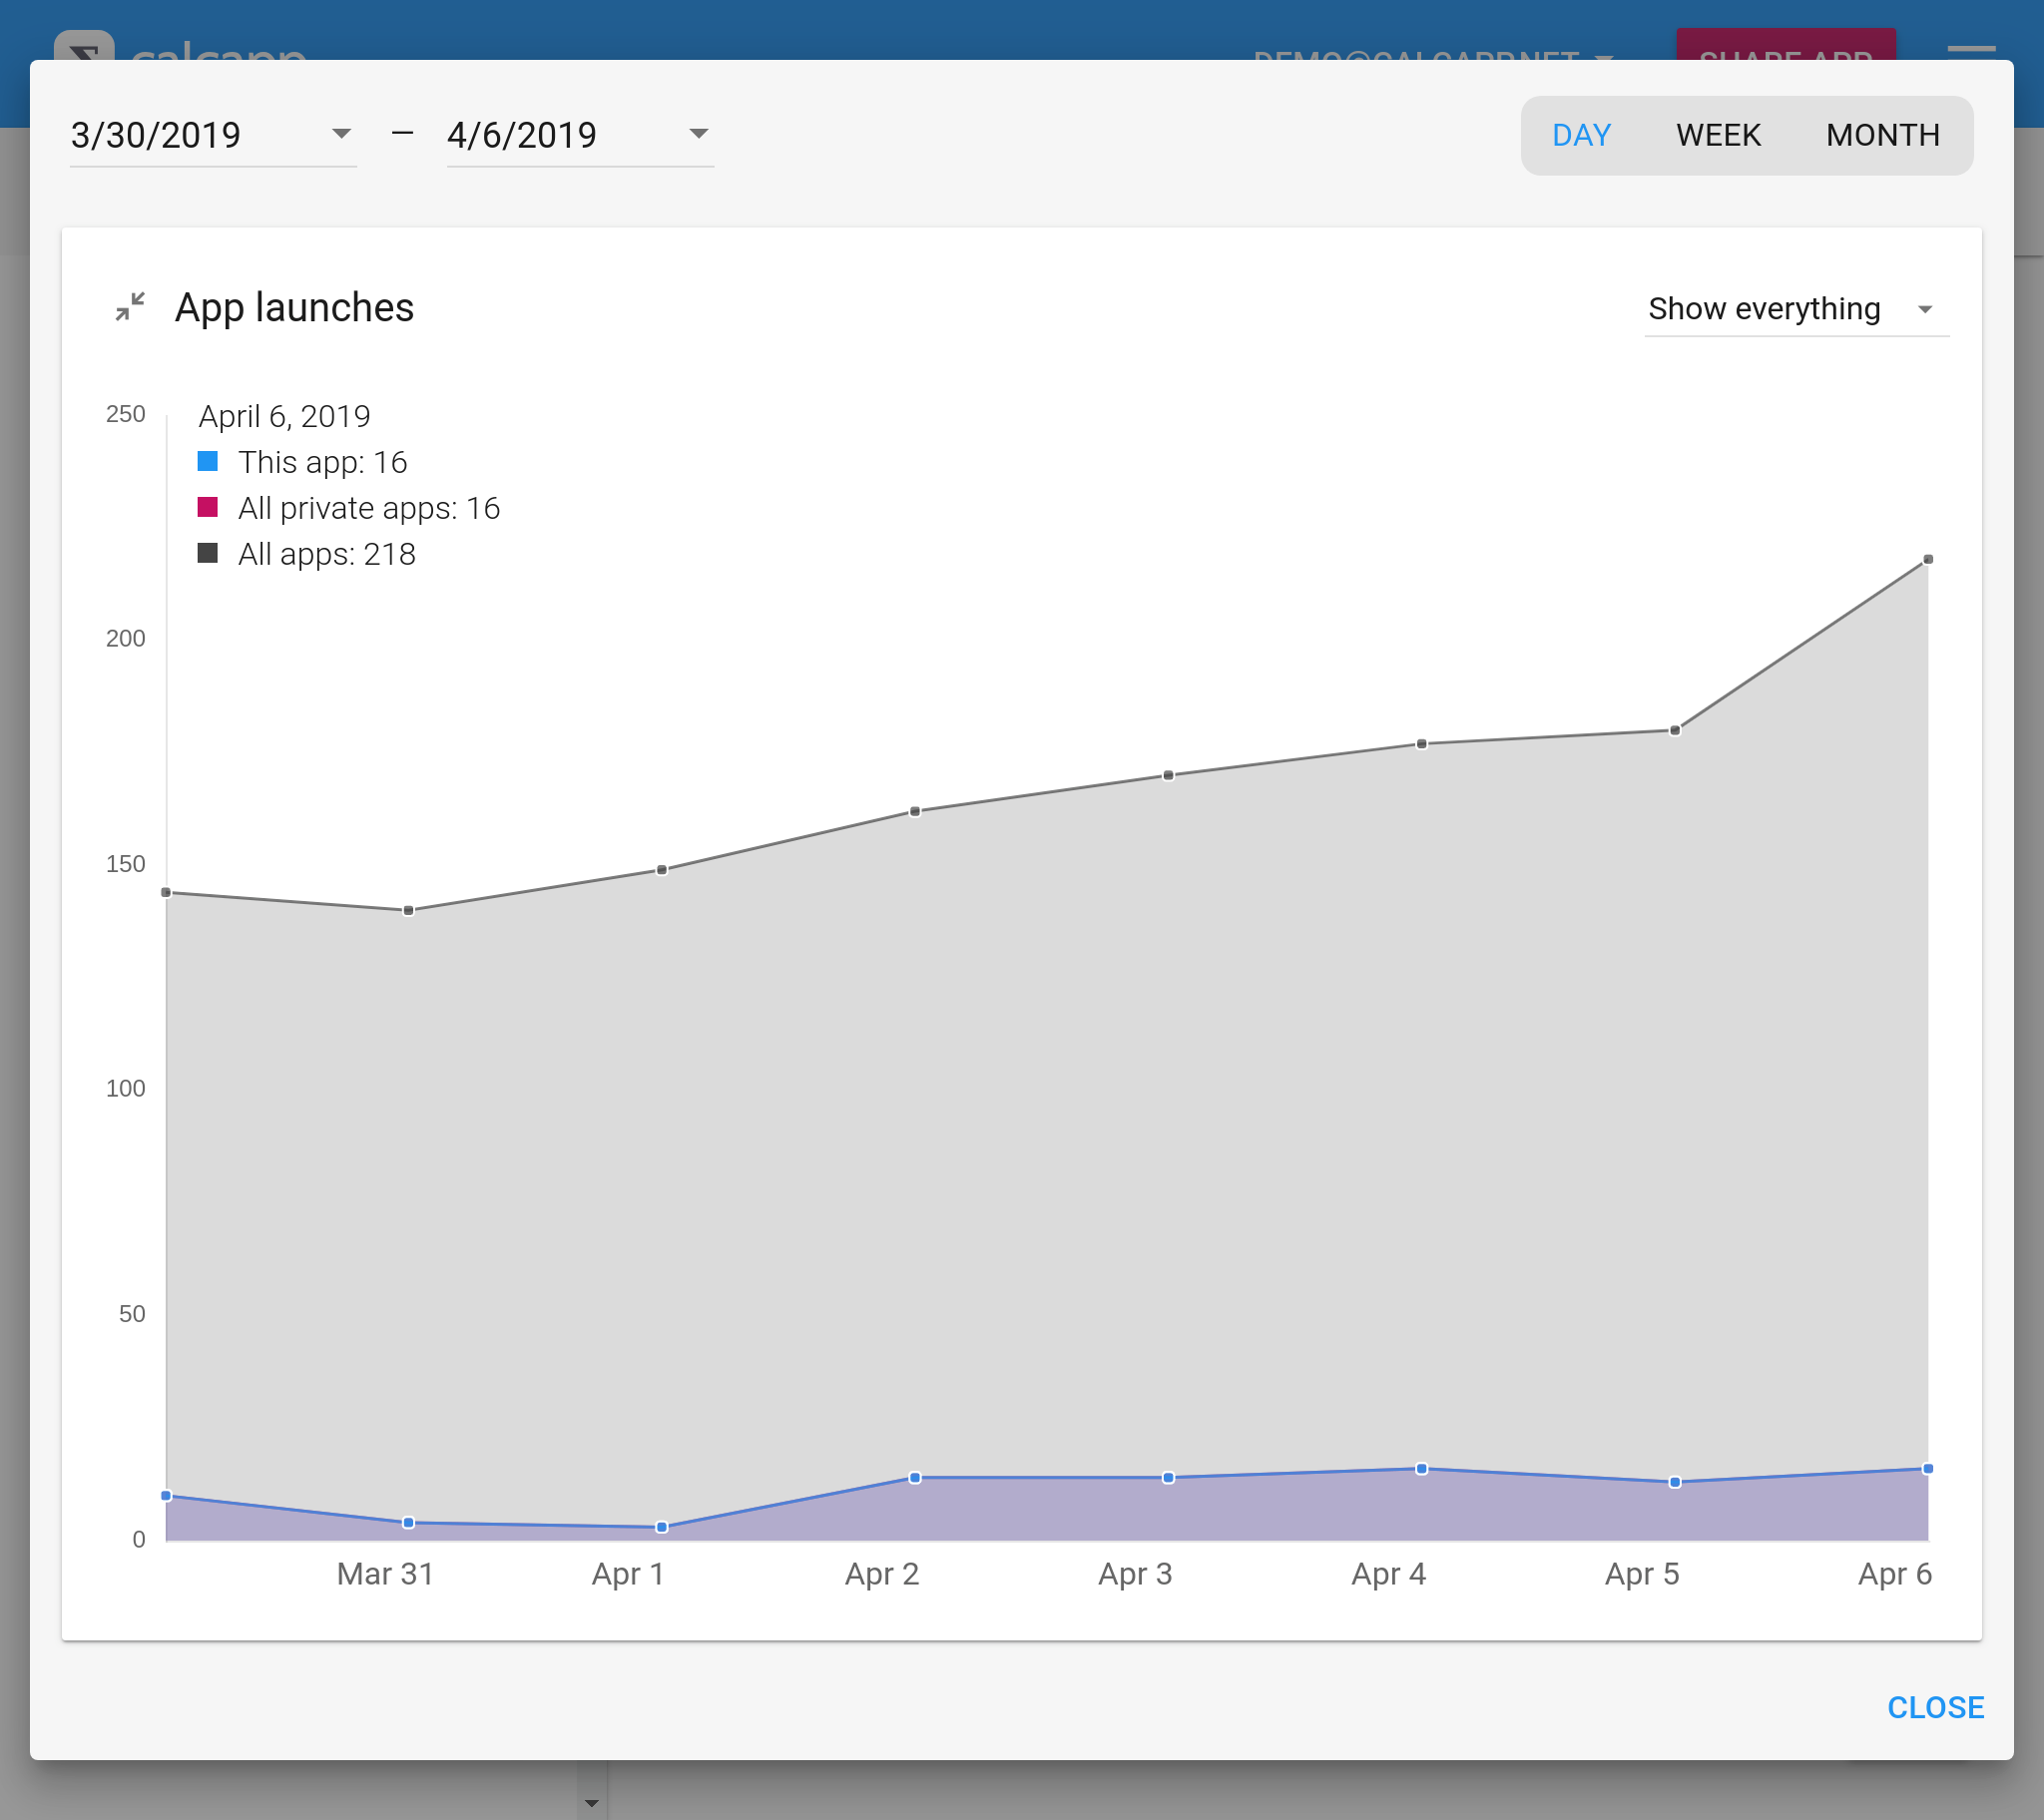
The drop-down in the upper-right corner of the quadrant (which reads Show everything above) can be used to determine if the numbers for only the active app should be shown, or aggregated numbers for either all apps of the same category as the active app (such as all private apps) or aggregated numbers for all apps.
To make comparisons between the active app and other apps, you can also select Show everything, as in the image above, which displays all the available information simultaneously. Here, we can tell that the active app, which happens to be a private app, is launched far fewer times than the public apps which are part of the same account.
When we added support for paid plans to Calcapp, we also had to develop counters which keep track of app usage. The statistics feature grew out of that work. As such, we never intended for it to be a full replacement for an analytics service. While we’re not opposed to adding more functionality, we’re also interested in adding integration points with existing analytics software.
If you’re interested in, say, where in the world your users reside or what features of your app they’re using, we need to determine if it makes sense for us to add these features ourselves or if we should plug this data into Google Analytics, Mixpanel or another analytics service.
We welcome your feedback, as always.