We introduced the new Statistics window in April, which answers some of the questions you may have about how your app is doing. A few weeks ago, we added statistics on individual users to the window.
While the Statistics window offers quite a few options for viewing app statistics, we’ve heard from customers with more specialized needs. To that end, we’re now introducing the ability to download the raw data as a CSV file (containing comma-separated values).
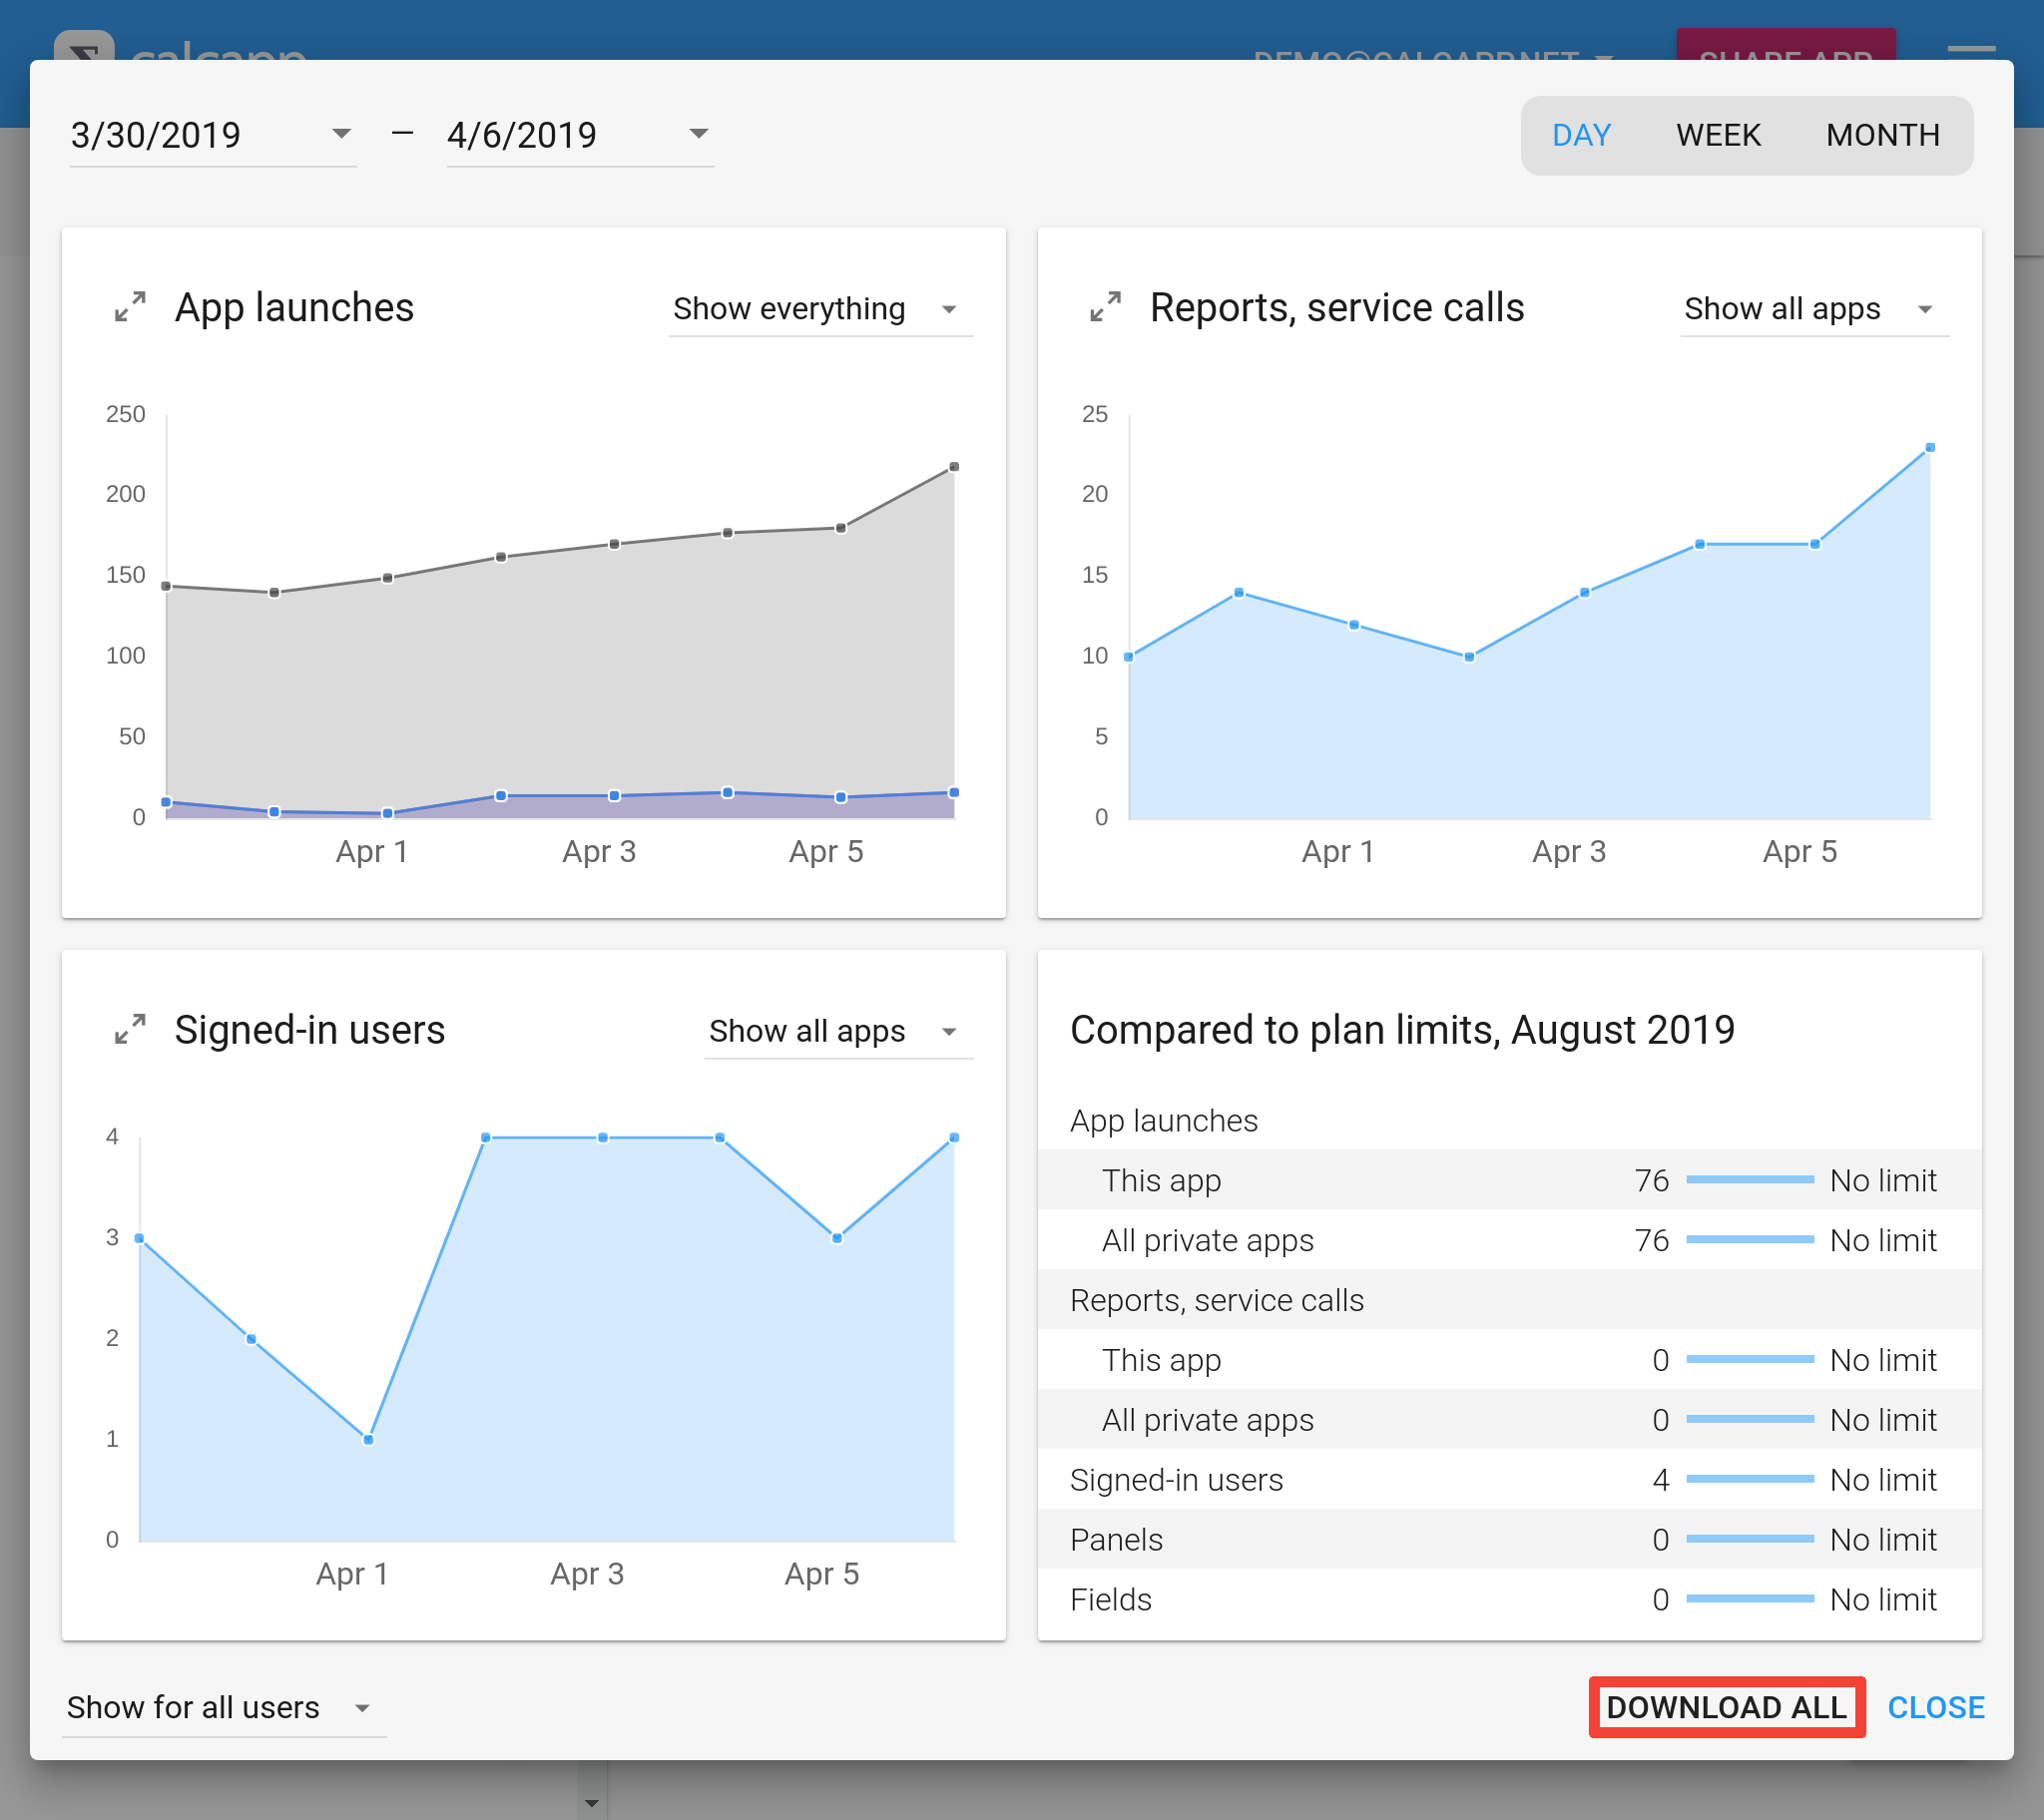
Click the new Download all button in the window to download the file:
This file can easily be imported into any spreadsheet, such as Microsoft Excel or Google Sheets. With the flexibility of a spreadsheet, you can create graphs which are currently unavailable in the Statistics window and use standard spreadsheet formula functions to process the data.
Here’s an example of the data generated for a private app:
| Date | Transmit count | Launch count | User email address |
|---|---|---|---|
| 2019-07-29 | 0 | 2 | john@example.com |
| 2019-07-29 | 0 | 2 | doreen@example.com |
| 2019-07-29 | 0 | 5 | amy@example.com |
| 2019-07-29 | 0 | 1 | brett@example.com |
| 2019-07-29 | 0 | 5 | jim@example.com |
| 2019-07-29 | 0 | 2 | robert@example.com |
| 2019-07-29 | 0 | 1 | lisa@example.com |
| 2019-07-29 | 2 | 19 | |
| 2019-07-30 | 2 | 1 | doreen@example.com |
| 2019-07-30 | 0 | 1 | lisa@example.com |
| 2019-07-30 | 2 | 2 | |
| 2019-08-01 | 2 | 3 | amy@example.com |
| 2019-08-01 | 2 | 3 | |
| 2019-08-02 | 2 | 3 | brett@example.com |
Dates use the ISO 8601 standard, making them easy for spreadsheets to recognize as dates. The Transmit count column has data on the number of times reports have been sent and the number of times service calls have been made. (A service call occurs when your app contacts a third-party service, such as Zapier, to do things like insert a row in a Google Sheets spreadsheet.) The Launch count column has data on the number of times your app has been launched.
The User email address column is always blank for apps which are not on a private plan. For private apps, it contains the email addresses of your users, giving you data on how often your users send reports, make service calls and launch your app.
Even for private apps, the User email address column contains blank rows. These rows contain global data. For instance, a row with a blank User email address column contains the total number of times your app has been launched on a particular date. On July 30 in the table above, you can tell that doreen@example.com and lisa@example.com have launched the app once each, making the global launch count 2.
These numbers don’t always add up in the way you’d expect. For instance, on July 29, seven different users launched the app. If you add the launch counts together for these seven users, you get the number 18. And yet, the global launch count for that day is listed as 19.
This happens when users have been removed. A user started the app on July 29 who is no longer part of your list of users. As such, while this user isn’t listed, he or she is still counted for the global launch count.
Do you need any other features related to statistics? Let us know!